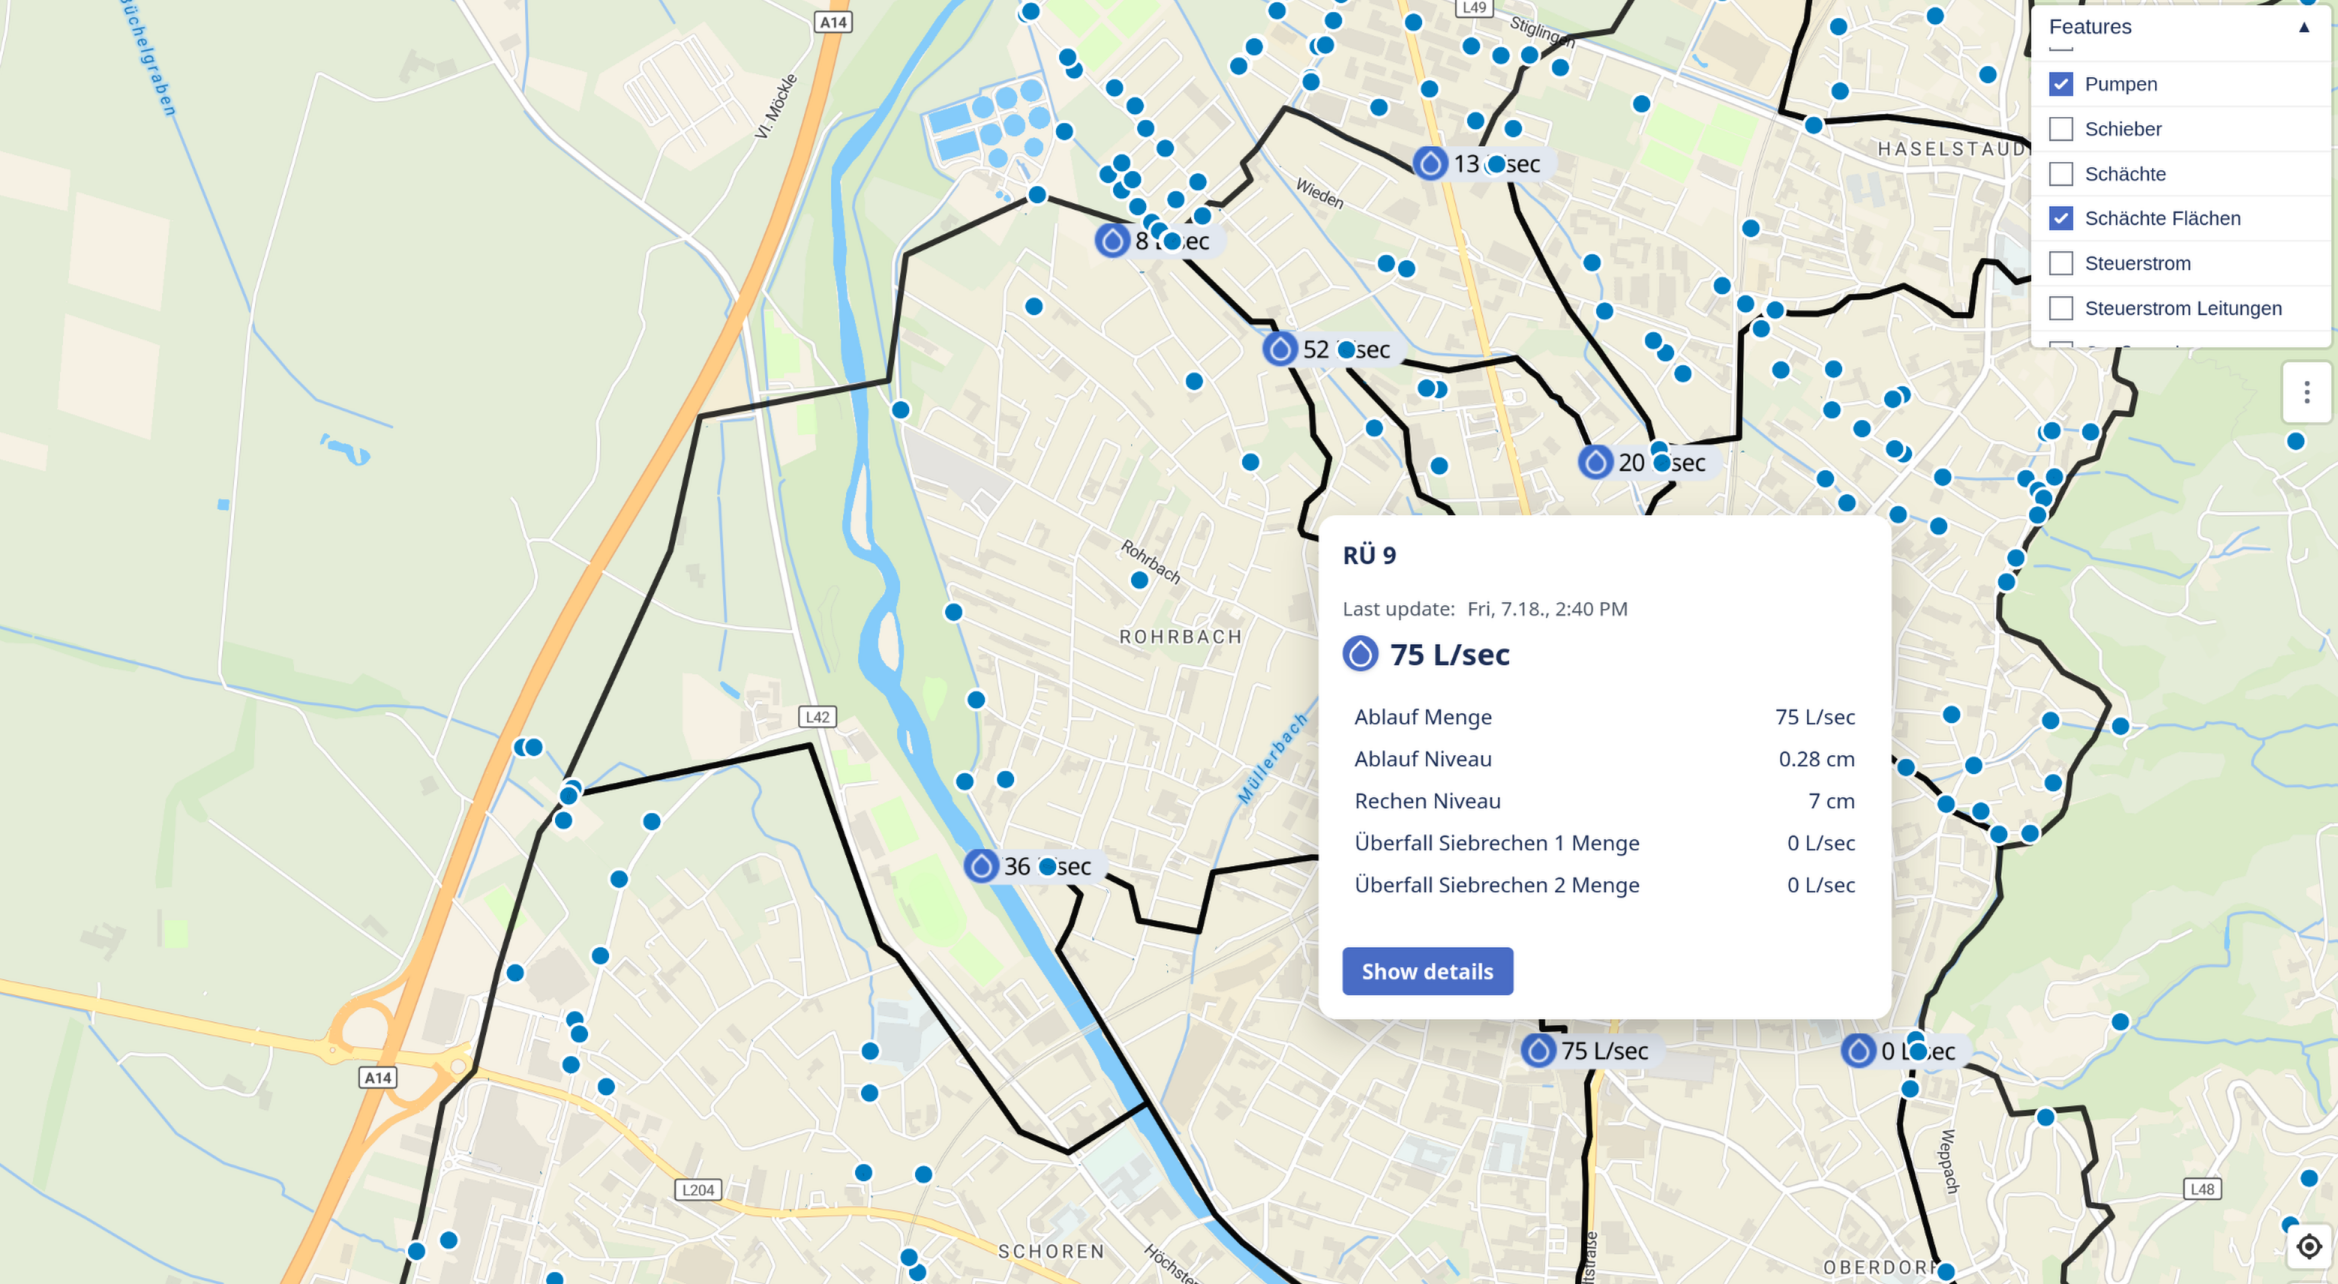
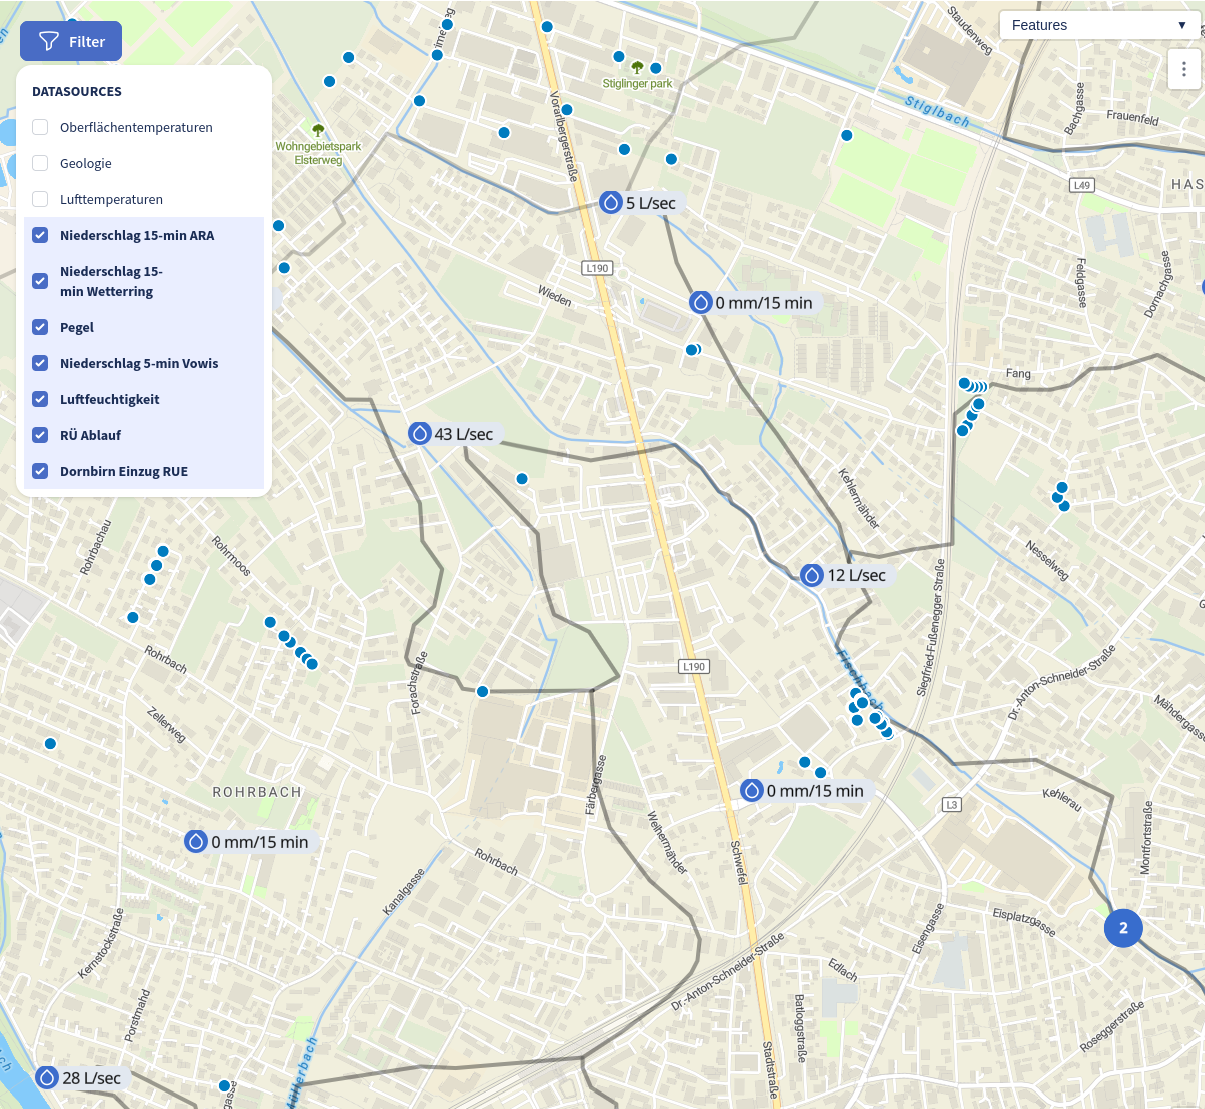
GIS integration in Citymonitor combines real-time sensor data with spatial information for location-based environmental analyses. By overlaying environmental data with geographical boundaries and zones, cities and companies can improve their environmental monitoring and resource optimization.


IoT, PV, open data, GIS — all in one platform, live and evaluable.
QGIS, ArcGIS, WMS/WFS, shapefiles—seamlessly connect to your maps and layers.
Smart metering, PV monitoring, leak detection, consumption optimization.
Crisis management, webcam integration, automated alerts.
Public dashboards, feedback channels, real-time alerts.
Open interfaces, third-party integration, flexible data connection.


Achieve climate goals and monitor environmental data in real time — optimize efficiency and save costs through intelligent data integration.

Solid data is needed to achieve the energy revolution. We digitize & visualize your climate data and make effectiveness and costs visible.

Monitor environmental data in real time and react proactively. Automatic recording saves time & money and creates a comprehensive data base.
Tailored analyses for various scenarios — from energy consumption to precipitation and runoff data,
everything in one central platform.


Use cutting-edge IoT technology to make your city smarter, more efficient and future-proof. Maximize efficiency with flexible data integration, customizable dashboards, automated reports, and intelligent forecasting.
With our extensive catalog of sensors and interfaces, you can integrate data in no time at all. Many electricity, water or heat meters can be easily integrated with just a few clicks.

Our dashboards provide a customizable interface to visualize your energy and environmental data. Simply adapt presentations to your individual needs.

With the reporting feature, you can export dashboards or send reports automatically. Identify trends, evaluate initiatives, and make strategic decisions based on solid data.
Our forecasts make it possible to predict future trends and developments in your municipality. Based on historical and current data, they help with smart planning and efficient use of resources.
Connect to ArcGIS Online and Enterprise for advanced mapping.
Import and export data layers, create custom spatial analyses.
Transform environmental monitoring with location-based intelligence
“Citymonitor's GIS integration capabilities have transformed how we monitor air quality in our city. By combining sensor data with traffic zones and industrial areas, we have reduced air pollution by 25% and significantly improved citizen satisfaction.”
“Citymonitor's emergency dashboards with webcam integration have revolutionized our crisis response capabilities. We can now monitor critical infrastructure in real time and coordinate emergency responses 50% faster than before.”
“Comprehensive sensor support and flexible integration capabilities made it easy to connect our existing infrastructure. We saw a 30% reduction in energy costs within the first year, and the real-time alert system prevented several environmental incidents.”
“QGIS integration and spatial analytics have given us unprecedented insights into our environmental data. We can now analyze district-specific trends and make data-based decisions that directly influence our sustainability goals.”
Our customers typically see 25-35% cost reductions in energy and water management, 50% faster emergency response times, and significant improvements in operational efficiency within the first year.
Yes! Citymonitor offers threshold-based alerts with customizable triggers, push notifications, email fallback, and escalation workflows for various types of environmental incidents.
Yes! Citymonitor offers API access for custom applications, automated reporting with PDF/CSV exports, and integration with third-party analytics tools.
Our emergency dashboards combine real-time environmental data with webcam monitoring and GIS integration. This enables faster crisis response, automated alerts, and coordinated emergency management.
Yes! Our platform offers automated reporting, audit trails, and compliance monitoring features to help meet environmental regulations and sustainability reporting requirements.
By providing real-time environmental data and spatial analytics, Citymonitor enables data-driven sustainability decisions, helps track progress toward climate goals, and supports ESG compliance reporting.
We offer custom deployment planning, sensor selection consulting, GIS integration strategy, training for your team, and ongoing support with dedicated account management.
Our platform features automatic failover, high availability with data redundancy and uptime guarantee.
Pilot programs typically take 3-6 months, while full deployments can be completed in 6-12 months depending on scope. Our team provides comprehensive support throughout the process.
Yes! We recommend starting with a pilot program to validate the solution and see measurable results within 90 days. Our flexible pricing includes pilot programs for testing and validation.
Absolutely! Citymonitor supports multiple protocols including LoRaWAN, MQTT, HTTP, Modbus, and custom integrations. We can connect to your existing sensor infrastructure without requiring hardware changes.
Our platform processes data with sub-second latency with automatic failover and 99.9% uptime guarantee. We use cloud-ready infrastructure that automatically scales to meet your data volume needs.
Citymonitor supports IoT sensors, PV systems, smart meters, open data sources (such as VOWIS water data), government weather services, and your existing GIS layers. We can connect virtually any data source through our flexible integration framework.
Spatial analytics enables you to correlate environmental data with geographic features, analyze district-specific trends, and create location-based alerts. This allows for more targeted environmental management and policy decisions.
Yes! Citymonitor is designed to work with your existing GIS systems. We can integrate with internal GIS infrastructure, open data portals, and government data sources to enhance your current spatial analysis capabilities.
Citymonitor integrates seamlessly with QGIS and ArcGIS (Online and Enterprise). We support WMS/WFS layers, custom shapefiles, and real-time spatial data processing for comprehensive environmental analysis.


Schedule a demo now and see how Citymonitor is your city can make you smarter and more efficient.
Schedule a demo now